Gantt Chart Widget for Figma & FigJam
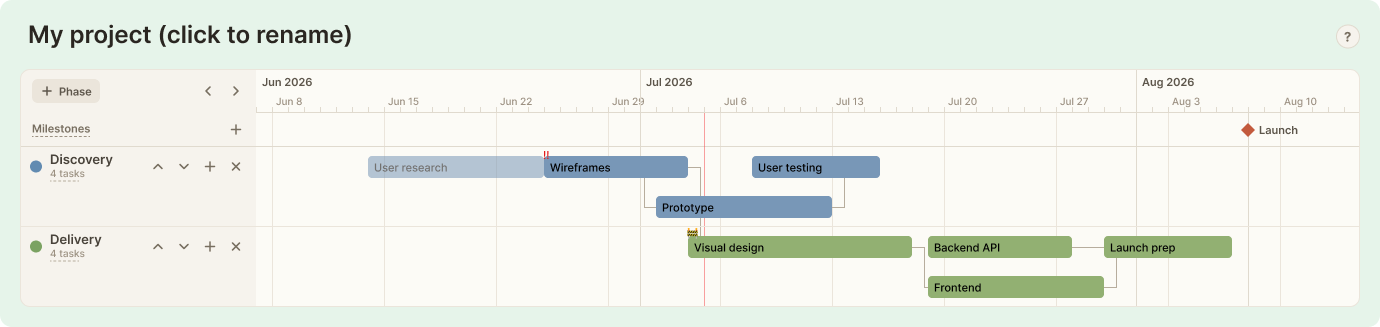
Plan projects right on the Figma canvas. The Gantt Chart Widget turns a Figma
or FigJam board into a dependency-aware timeline — task bars scheduled by date,
depends-on arrows between them, milestones, and automatic schedule-health cues
(overdue / blocked / done). Not just a picture of a schedule: it tracks what waits
on what.
🚀 Get the widget on Figma Community → (opens in a new tab)
Why this widget
- Task dependencies —
depends-onarrows between bars; a task waiting on an unfinished predecessor turns blocked automatically, and cycles or dangling links are rejected. The piece most Figma timelines leave out. - Gantt timeline on the canvas — bars positioned by start/end date, at day, week, month, quarter or year zoom.
- Phases — coloured swim-lane rows you can rename, reorder, recolour and delete inline.
- Milestones — point-in-time diamonds on their own lane, with a label and colour.
- Schedule health — every task is derived as on-track / overdue / blocked / done and flagged on the bar, never manually maintained.
- Made for teams — lives in Figma & FigJam, so planning happens next to the design work, not in another tab.
Free vs paid
The free tier covers small plans — up to 8 items, 2 phases and 1 milestone. The paid upgrade (through Figma's native checkout) lifts those limits for full projects.